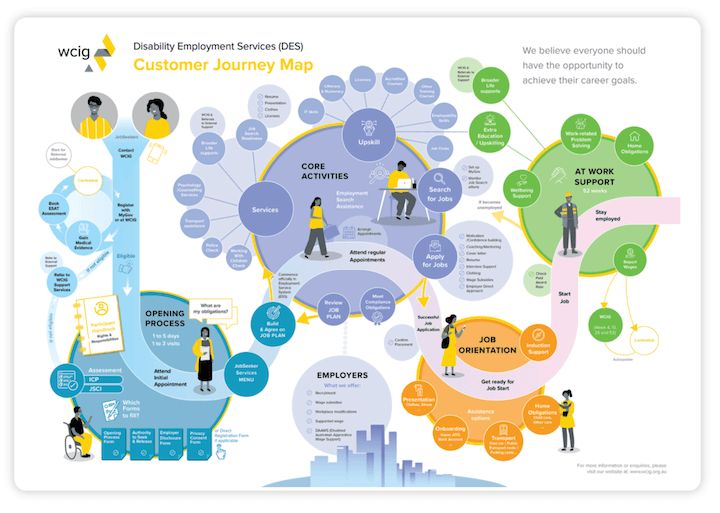
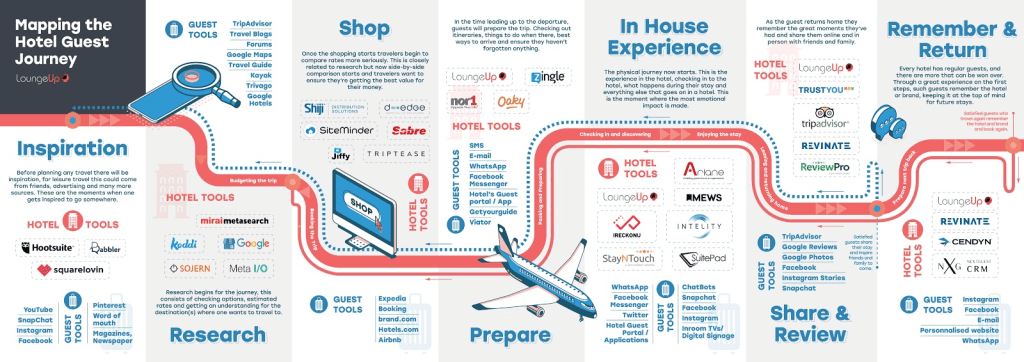
Although these photos look like intricate monopoly game boards, they are actually detailed accounts of a specific user experience called “journey maps”. “A customer journey map tells the story of the customer’s experience: from initial contact, through the process of engagement and into a long-term relationship.” (Boag, 2015) The goal is to teach organizations more about their customers. It helps companies understand how customers move through sales funnels, how they move from one device to another, or how they navigate a website for example. “It often provides a sense of the customer’s greater motivation. What do they wish to achieve, and what are their expectations of the organization?” (Boag, 2015)
Research
Creating a journey map starts with user research. Whether it is analytical where user data is gathered or anectotal where personal experiences are explored, this is the start to creating the most authentic and efficient journey map. By using reaserach from users, journey maps “help organizations evolve from a transactional approach to one that focuses on long term relationships with customers built on respect, consistency and trust” (Grocki, 2014)
Must-Haves
Journey maps should be an infographic that is easy to understand and “it should highlight users’ needs, questions and feelings throughout their interaction with the organization” (Boag, 2015). They shouldn’t be too complex and are meant to be simple and easy to understand. However, they should include the following:
- Personas: these are the main needs, goals, thoughts, feelings, expectations and pain points of a specific user.
- Timeline: this is the defined amount of time of the user journey.
- Emotion: these represent the feelings of the user that include anxiety, frustration, confidence that can be elicited by an empathy map.
- Touchpoints: these are the actions and interations that the user has with the organization.
- Channels: these identify where interaction takes place and the context of use such as website, social media app, or store (Grocki, 2014).
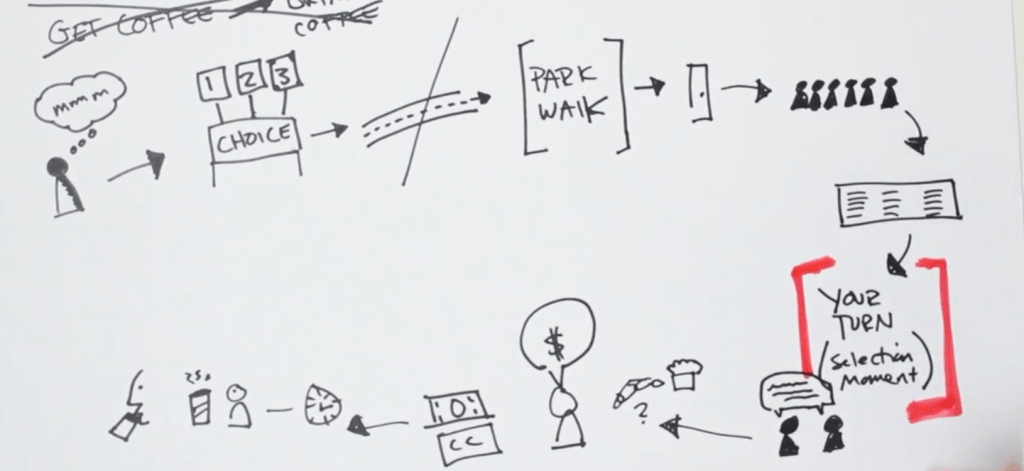
Coffee Journey Example
Beyond helping you understand the whole picture of an experience, journey maps can help you find moments where there could be improvement. Finding ways to create interventions in an experience can make huge changes to a user’s experience that can affect their final conversion or satisfaction (Sanford Design School, 2014). For example, if a journey map is mapping a customer’s coffee purchasing experience and they have a challenging time at the time of selection, the map can identify that this is a key pain point in their journey. Then, the coffee company can try to make that selection experience better by making the choices clearer, offering better customer service, offer better music, or anything that can change the whole journey for a better outcome.
Ski Journey Example
Another example of a journey map would be the map below which describes the experience of taking a day trip to go skiing. Click HERE for a closer view.

In this map, the five must-haves are included:
- Persona: The map includes a ski customer (Samantha) who is described as a hard-working mom who is looking for an active day trip for her sons that isn’t too expensive or far away from her home.
- Timeline: A timeline of one day is identified for the actual trip but all of the research, selection, and gear purchasing would be done a month out from the actual trip date.
- Emotion: Samantha’s emotions were described at each point of the journey with the thoughts and expectation icons. At the beginning of the journey she initially feels excited, but then the selection, purchasing gear, and traveling stages create many negative emotions such as anxiety and frustration. However, at the end of the journey when she gets to ride the chairlift and ski down, all of her emotions change to positive and confident.
- Touchpoints: All of the touchpoints are listed at each stage of the journey such as Samantha’s actions and who she interacts with. For example, she interacts with people when she is traveling with her family, getting rental skis from the resort, and loading onto the chairlift with the resort staff.
- Channels: The map describes where Samantha is at each point the context. For instance, she looks for ski gear on TikTok, whereas she searches the web for ski resorts and discount lift tickets.
Takeaways
This journey includes a symbol that symbolizes where there is opportunity for improvement. This is an important symbol to observe because it can create opportunities for interventions and identify points in the journey that can be improved. For example, at the beginning of Samantha’s journey, there is very little human interaction and that is where the most purchasing takes place. To improve the user experience, the ski gear companies or ski resorts could offer more interactive approaches to gain the customer’s trust such as more videos, interactive chat boxes, phone sales agents, or 360 interactive maps of the resort.
In addition, most of the symbols for opportunity for improvement take place at the beginning of Samantha’s journey. The areas for improvement include too many options with no return policies at the ski resorts, long lines at the ski rental counter and chairlift, and etc. The areas with no need for improvement take place when she is actually skiing in the end, which is only one touchpoint in the whole journey. Therefore, many operational points can be improved to reduce stress when purchasing tickets and to decrease wait times.
Most importantly, the emotions presented in Samantha’s journey are important to note for a better overall user experience. In the first half of her journey, all of her emotions involve frustration, annoyance, and anxiety. In the latter half of her journey, all of her emotions are optimistic and confident. Therefore, the ski resorts should make some changes in the purchase process, the ski rental process, and chairlift process to ease some of the anxiety to make it less stressful to purchase tickets at the beginning of the journey.
Conclusion
Although empathy maps, personas, and brainstorms are all helpful processes to gather user information, a journey map is an asset that can truly help companies see the whole experience in one image. You might be able to present information in text form, but having a clear visual of a user’s journey is an extremely efficient way of communicating the actions, touchpoints, channels, and emotions that a user experiences. To be able to visually point out the areas of improvement, pain points, and strong points in one image is an invaluable benefit of journey maps that would help all companies large and small.
Citations:
Boag, P. (2015, January 16). All you need to know about customer journey mapping. Smashing Magazine. https://www.smashingmagazine.com/2015/01/all-about-customer-journey-mapping/
Customer journey map how-to (+7 templates & examples). (n.d.). https://www.wordstream.com/blog/ws/2022/09/19/customer-journey-map-templates
Deepak, S. (2023b, January 17). 5 customer journey map examples you can learn from – smartkarrot. SmartKarrot l Customer Success Software. https://www.smartkarrot.com/resources/blog/customer-journey-map-examples/
Grocki, M. (2014, September 16). How to create a customer journey map. UX Mastery. https://uxmastery.com/how-to-create-a-customer-journey-map/
Stanford Design School. (2024, October 6). Journey Map. Vimeo. https://vimeo.com/78554759

Leave a comment